
We’ve continued to look at state administrative data on Medicaid enrollment changes, and we are seeing curious differences among 22 states that have posted May enrollment data.
Our baseline for Medicaid enrollment data is February since that is the last month before the pandemic really got going and the Medicaid disenrollment freeze became effective in March. And we are looking at cumulative growth (or decline) since February – not month to month.
The average cumulative gain in total enrollment among the 22 states is 5%. The average growth in child enrollment across 13 states is 4.0%. (Note: Our child enrollment data generally does not include children in separate state CHIP programs unless we can’t separate it out. A detailed spreadsheet and methodology are available here.)
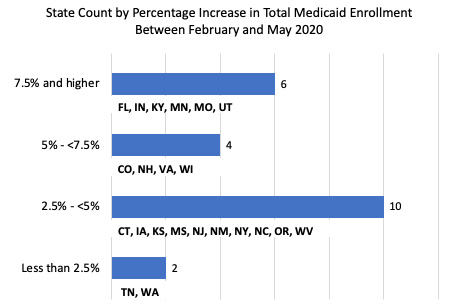
Six states – Florida, Indiana, Kentucky, Minnesota, Missouri and Utah – have considerably higher overall growth of greater than 7.5%, with Missouri leading the pack at 8.8% growth. Two states are below 2.5% growth – Tennessee and Washington.
As we have blogged about before, researchers have predicted potentially large growth in Medicaid enrollment as a result of the sharp increases in unemployment. Without comprehensive national data it is impossible to say definitively if those predictions are likely to hold up, but these state data suggest a worrying trend. Between Medicaid’s disenrollment freeze and the rapid rise in those losing their jobs, we would expect Medicaid enrollment to be going up more quickly – especially in those states with little growth.
Stay tuned – or even better – try to find out what is happening in your state.