The Census Bureau is expected to release topline findings from the American Community Survey next week that will include 2018 data on uninsured children. We have been anxiously awaiting these data since we first alerted Medicaid/CHIP stakeholders to the precipitous decline in Medicaid/CHIP early this year. Since then we have continued to monthly monitor enrollment and put out this more comprehensive brief in May 2019 covering the 2018 calendar year.
When we first reported on this issue, child enrollment in Medicaid had declined by half a million children in the first 10 months of 2018. That number has now more than doubled to more than 1 million children in the 17-month period between December 2017 and May 2019. As we have analyzed the monthly data, we consistently have seen about two-thirds of states with net child enrollment losses in Medicaid/CHIP although a few states have switched from gains to losses and vice versa. See state-by-state data here.
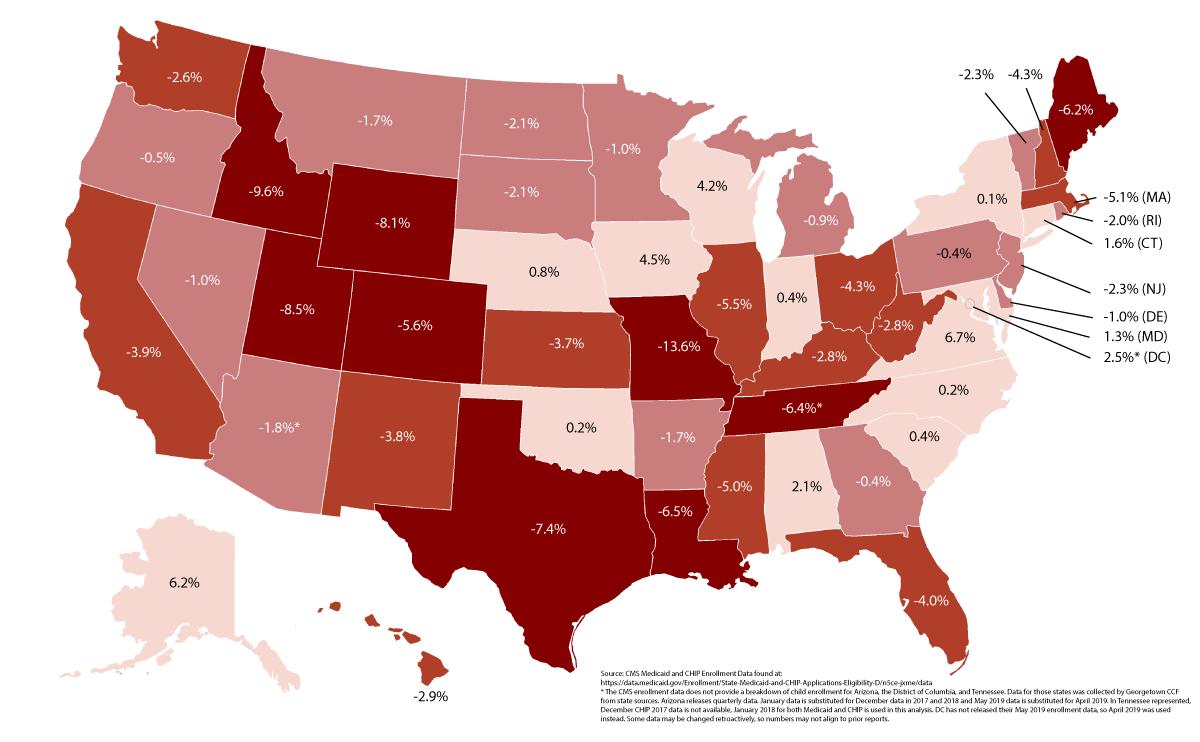
Missouri continues to top the list of states with the highest percentage decline in child enrollment in Medicaid that has grown from 9.0 percent in calendar year 2018 to 13.6 percent in the 17-month period through May 2019. Texas continues to account for the largest decline with a drop of more than one-quarter million fewer children in that same period.
Other statistics of interest:
- 60 percent of children losing coverage since December 2017 live in Texas, California, Florida, Missouri, and Illinois.
- Eight states – Missouri, Idaho, Utah, Wyoming, Texas, Louisiana, Tennessee, Maine, and Colorado – have experienced percentage declines at least two times the national average of 2.8 percent over the 17-month period.
- Nine states that experienced losses in 2018 have seen gains – mostly modest – in 2019. These states – Arkansas, Georgia, Mississippi, North Dakota, Ohio, Oregon, South Dakota, Pennsylvania and Tennessee – still have cumulative enrollment losses over the 17-month period.
- Kansas and Minnesota experienced modest gains in 2018 that have reversed into cumulative losses in the 17-month period.
A number of state and federal officials have opined that the enrollment decline is the result of a strong economy. However, there is scant evidence of real wage growth for lower-income workers and improved access to affordable employer-based health coverage. But we’ll know for sure how the trends in enrollment correlate to changes in insurance status when the Census data on health coverage is released next week.
If the data confirm our fears that many of these children are becoming uninsured, it will be imperative for state and federal leaders to take action to regain our country’s historic success in covering children. There are many opportunities for states and the federal government to ensure that all eligible children are able to enroll and retain coverage in Medicaid/CHIP as outlined in our report on the enrollment decline – from boosting outreach and consumer assistance to adopting policies that promote continuous enrollment to maximizing the use of technology to simplify enrollment and streamline the renewal process.