
States are required to routinely report to CMS a number of performance indicators but few have been published to date. The most current and frequent data that are available publicly include application volume by source, determinations by program, and both Medicaid and Children’s Health Insurance Program (CHIP) point-in-time enrollment (which CCF tracks and reports on monthly child enrollment trends).
In November of 2018, CMS published the first data on MAGI application processing times on a state level basis for three months, February through April 2018. Recently, the agency released a second report for the same time period in 2019. Keep in mind that these data reflect only applications for children, parents, pregnant women, and the adult expansion population – these are known as the MAGI groups, whose income eligibility is based on Modified Adjusted Gross Income. It does not include dual-eligibles or individuals eligible on the basis of disability.
Before we unpack the latest data, some background information may be helpful. A key goal of the Affordable Care Act (ACA) was to accelerate state use of electronic data to improve administrative timeliness, accuracy, and cost-effectiveness in determining eligibility. The overall timeliness standard – that is a requirement to process all applications within 45 days – did not change. However, a new standard, known as real-time determinations, emerged. Applications that are processed instantaneously in real-time through linkages to electronic sources of verification data (like quarterly wage data) or those that are processed overnight (states may use batch processes) are considered real-time determinations. These set a new gold standard for application processing. In addition to reporting real-time determinations, states must report the share of applications processed in 1 – 7 days; 8 – 30 days; 31 – 45 days; and over 45 days (which is out of compliance with federal regulations).
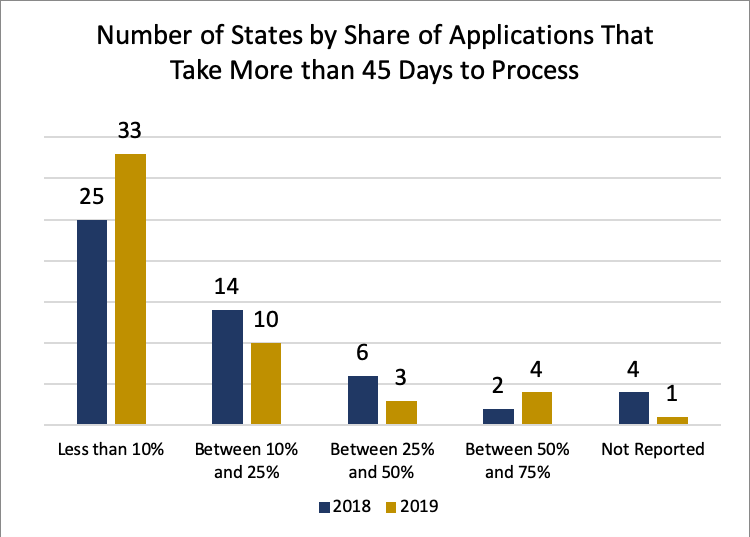
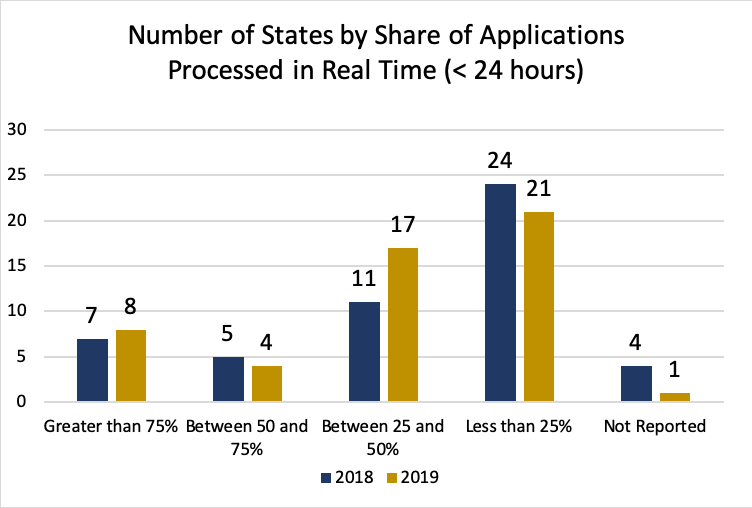
In comparing the data in the two reports, we observed some modest improvements – the most encouraging of which is that, overall, 42 percent of applications were processed in real-time in 2019 compared to 31 percent in 2018. And the share of applications that are not processed within the federal standard of 45 days decreased from over 18 percent to just under 14 percent. But there is significant variation among the states. Additionally, while four states were unable to report the data in 2018, Tennessee is the only state that did not report 2019 data.
While the number of states where fewer than 10 percent of applications take longer than 45 days to process increased from 25 states in 2018 to 33 states in 2019, the number of states where more than 50 percent of applications take more than 45 days increased from two states (GA and VA) in 2018 to four states (AK, ME, GA, and MO) in 2019.
On the positive end of the spectrum, the number of states that process fewer than 25 percent of applications in real-time decreased from 24 to 21 states. But still, in 2019, five states (MO, NC, NJ, NV and SD) report that less than one percent of applications are processed in real-time compared to six states in 2018 (KS, MO, NC, NV, SC and SD). And we’re stuck at only 12 states (AL, CT, DC, HI, ID, MA, MD, MN, NY, OK, RI, and WA) that are processing more than half of applications in real-time.
Eight states are processing more than 75 percent of their applications in real time, including Alabama, Connecticut, the District of Columbia, Maryland, New York, Oklahoma, Rhode Island, and Washington. These states can be looked to for best practices in harnessing technology and electronic data sources to automate and speed up the eligibility process. On the other hand, some states are in dire need of improvement. In Alaska, Georgia, Maine, and Missouri, more than half of applications take more than 45 days to process. These states are likely working under corrective action plans (CAP) with CMS to address deficiencies. Stakeholders may want to obtain a copy of the state’s CAP to better understand the challenges and how they are being addressed.
There will always be tricky cases where paperwork and/or manual intervention by eligibility workers is needed to gather information needed for an eligibility determination, and some of those may take more than 45 days to process. However, if states are successful in deploying systems that achieve a high share of real-time determinations, more attention can be paid to complex applications. And remember, high performing systems with strong linkages to electronic data provide the functionality for automating renewals, as well. Refining these systems is one of the key strategies to regaining enrollment momentum and resuming the nation’s progress in covering children.