Over 32.8 million children are covered by Medicaid, and the large majority are enrolled by their state Medicaid agencies in managed care organizations (MCOs). In exchange for monthly capitation payments, the MCOs contract with the state Medicaid agency to furnish covered services through networks of providers. These arrangements, in 40 states and the District of Columbia, have been an increasing source of revenue for the “Big Five” Medicaid managed care companies. So, what are the MCO subsidiaries of these companies—and other MCOs—doing with the billions that Medicaid pays them? How much is being used to pay providers for services to Medicaid beneficiaries? And how much goes to other purposes like quality improvement, administrative overhead, and profit? And how would the public know?
There’s a report for this: the Annual Medical Loss Ratio (MLR) Report. Every MCO is required to file one with the state Medicaid agency every year, whether or not the state imposes a minimum MLR requirement on its MCOs or collects a remittance if the MCO spends less than required on medical care. (States don’t have to hold MCOs to a minimum MLR, and even if they do they don’t have to require MCOs to pay remittances, but that’s another story). In the report, the MCO has to calculate its MLR for the most recent year and provide a number of specified data elements used in that calculation. The MCO’s MLR is really important, but it’s the data elements that provide a more detailed view of how the MCO is applying its Medicaid revenues.
So, what’s an MLR, and why does it matter? Generically, an MLR is the percentage of premium revenues that a health insurer spends paying for medical care. (From the technical insurance perspective, amounts paid out for medical care are considered “losses.”) The insurer uses the rest of the premium revenues to cover administrative costs and retain a profit (or, in the case of nonprofit insurers, a surplus). Investors like publicly-held companies to produce low MLRs, because that means more of the company’s premium revenue is available for payments to shareholders (so long as administrative expenses are kept in check).
Medicaid has its own definition of MLR. (Math alert: Long division ahead). The numerator is (1) amounts the MCO paid to providers for covered services plus (2) amounts it spent on activities to improve quality plus (3) amounts it spent on fraud prevention. The denominator is (1) the amount of capitation payments the MCO received minus (2) the amount of Federal, State, or local taxes plus licensing and regulatory fees or assessments it paid. Divide the numerator by the denominator and you get the MLR for that MCO for the contract year.

Every MCO has to calculate its MLR using this formula and include it in its annual MLR report for the most recent contract year. It also has to include in its report data elements used to calculate the MLR that are specified and defined in federal regulations. For our purposes the most important are:
- total incurred claims (basically, amounts paid to providers)
- expenditures on quality improving activities
- fraud prevention activities
- premium revenue
- taxes, licensing, and regulatory fees
- non-claims costs
Non-claims costs are not in the MLR formula, but they are an important piece of the MCO financial puzzle. They are “expenses for administrative services” that are not incurred claims, expenditures on activities that improve quality, or taxes, licensing, and regulatory fees. Non-claims costs enable federal and state regulators to judge how efficient (or bloated) an MCO’s administrative spending is. The regulations do not require the annual MLR report to include profit or contribution to surplus, but this figure can be estimated using the other data elements.
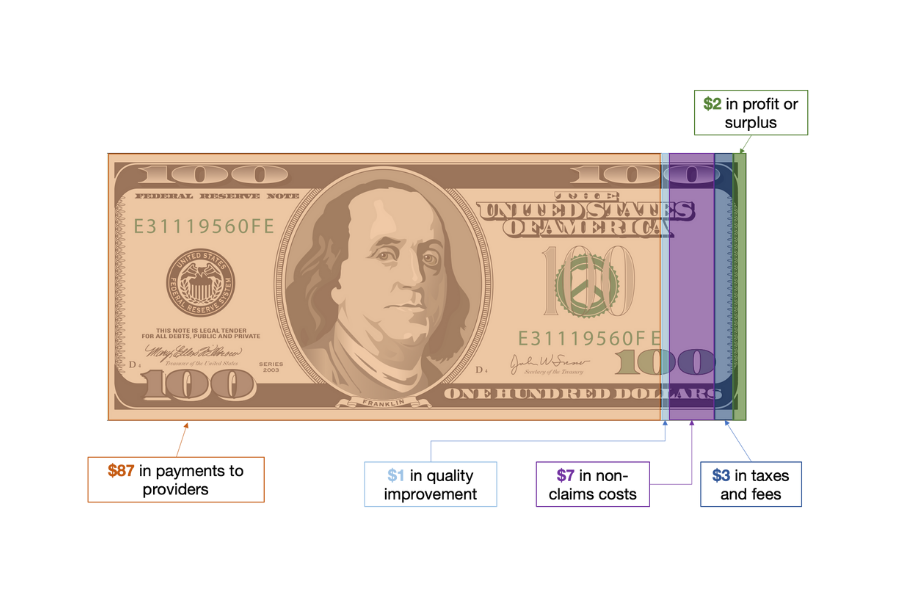
The report provides the premium revenue for the contract year. It also provides the amounts the MCO spent on paying providers for services, improving quality, fraud prevention, other administrative services, and taxes, licensing and regulatory fees. What remains is profit or contribution to surplus. For example, if an MCO receives $100 in capitation revenues and spends $87 to providers, $1 on improving quality, $7 on other administrative services (“non-claims costs”), and $3 in taxes and fees, then by process of elimination, the remaining $2 of premium revenue is profit or surplus. These numbers are for illustration only. They are from audited 2020 annual MLR reports posted on the Arizona Medicaid agency’s website and are scaled to a $100 capitation payment (add six zeros and you’re closer to the real world). These numbers will vary by year, by state, and by MCO.

Georgetown University Center for Children and Families analysis of audited 2020 annual MLR data for Banner University Family Care, Care 1st Health Plan of Arizona, and Health Choice Arizona. The MCOs reported no material spending on fraud prevention during this time period. Data available at https://www.azahcccs.gov/Resources/OversightOfHealthPlans/contractedhealthplan.html.
The reports are not standardized. Currently, states have the discretion to determine what format MCOs use to submit their annual MLR reports to state Medicaid agencies (spreadsheets, formal reports from actuarial firms, etc.). However, CMS is developing a reporting template for states to report to CMS summaries of the MLR reports the state Medicaid agencies receive from MCOs. Whatever the format, the information in the report allows the public to understand how different MCOs in the state compare on how much they payout for services, how much they spend on improving quality, how high their administrative costs are, and how large their profit margins are. These comparisons, in turn, can lead to questions for the MCOs and the state Medicaid agencies that can improve the accountability of both.
A note of caution is in order here. As our colleague, Karen Davenport recently reminded us, the data element for spending on activities that improve health care quality is vulnerable to manipulation. CMS has documented instances in which insurers that offer products on the Marketplaces have loaded costs into this expenditure category that do not belong there, such as costs related to marketing, lobbying, entertainment, and travel. Presumably, they do so in order to increase their MLRs and avoid paying rebates to consumers. This is directly relevant to Medicaid because Medicaid uses, in part, the same regulatory definition of “activities that improve health care quality” that applies in the Marketplace. In states that impose minimum MLR requirements and enforce them by requiring remittances, MCOs have an incentive to inflate their spending on these activities when necessary to meet their MLR targets and avoid paying remittances.
How can advocates obtain these reports? Federal regulations require that state Medicaid agencies post certain types of managed care information, such as their risk contracts with MCOs and the results of audits of the MCOs, but not the MLRs for each MCO or the annual MLR reports themselves. To their credit, some states, including Iowa and Virginia, post MLRs reported by individual MCO’s; to its great credit, Arizona, posts at least some of their MCOs’ audited annual MLR reports. While we have not conducted a 40-state scan, our guess is that in many states it’s likely that advocates will need to request the information under their state’s public records act. Since this is a publicly mandated report about the expenditure of public funds on behalf of public program beneficiaries, there is a compelling rationale for disclosure—without redaction.